Skip to content

Blog

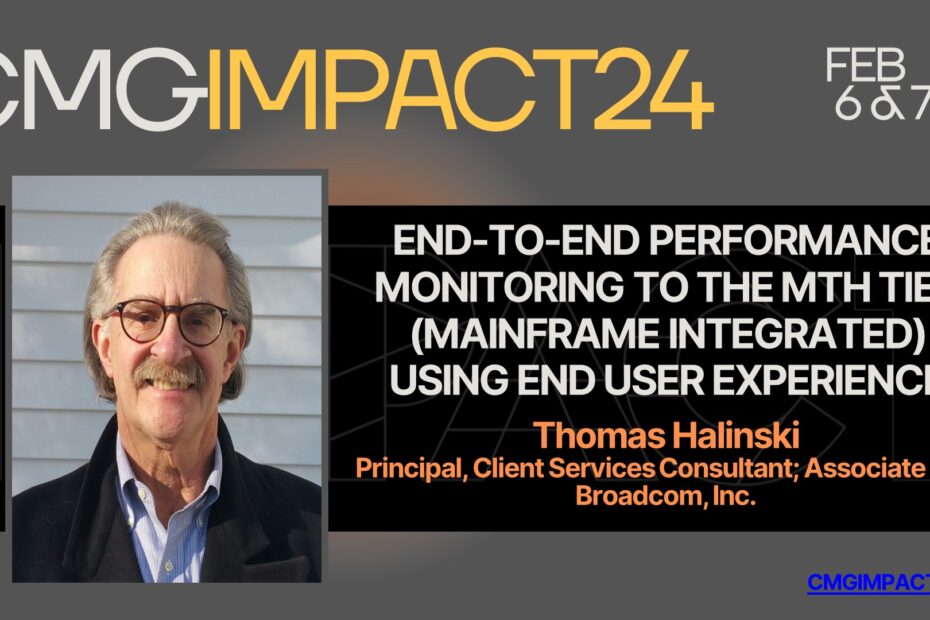
End-to-End Performance Monitoring to the Mth Tier (Mainframe Integrated) using End User Experience

An “end-to-end performance monitoring” view of an enterprise, is based on the “End User Perspective”, as proposed by the Apdex Alliance*. This includes the “application” perspective, and it means that “Performance Is The User Experience”.
Since the 80/20 Rules Have Flipped, there is a new approach to overall performance monitoring. The old rule said that 80% of your users are in your primary offices and that 80% of you traffic is inside your network. Therefore, if you deliver good service to the 80% you know, then you are well ahead of the game.
The new rule says that 80% of the users are outside your primary offices and that 73% of application service problems are reported by end users, not by the IT department.
This session will show the flow of data, where it gets impacted (cloud, distributed and Mainframe) and how to monitor performance from the “End User Experience” – thus avoiding silo monitoring with a “war room” type analysis.

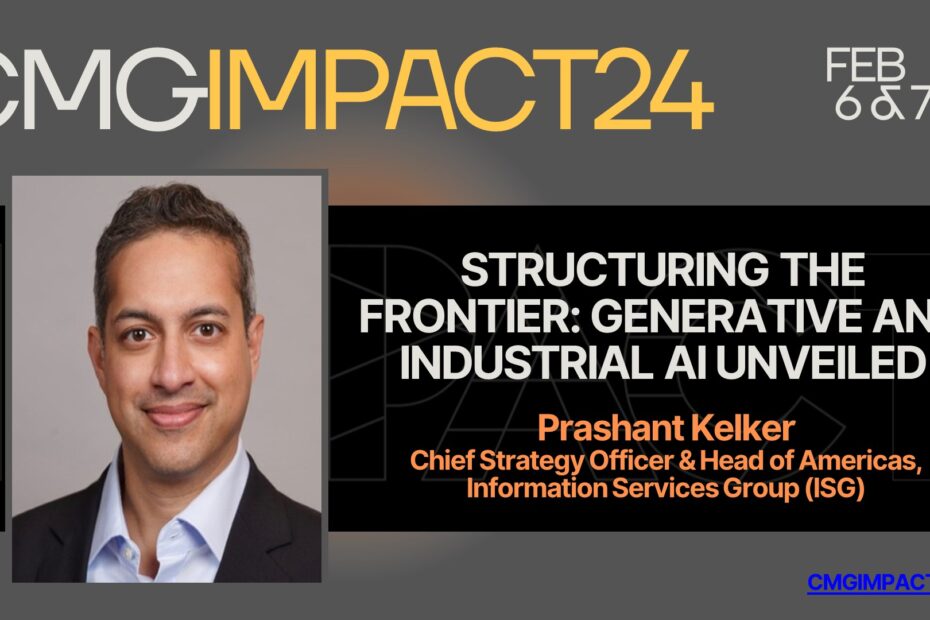
Structuring the Frontier: Generative and Industrial AI Unveiled

Join ISG’s Chief Strategy Officer – Prashant Kelker – for a straightforward look at the latest advancements in Generative and Industrial AI. This session, based on a recent research study of over 50 enterprises and technology platforms, will deliver key insights into successful applications and evolving practices in the field. We’ll also discuss emerging architectures and governance patterns in this emerging technology area.

Gain a clear, focused insight into the present status and future possibilities of Generative and Industrial AI, with access to practical strategies and information sourced directly from recent research and application.

slide2

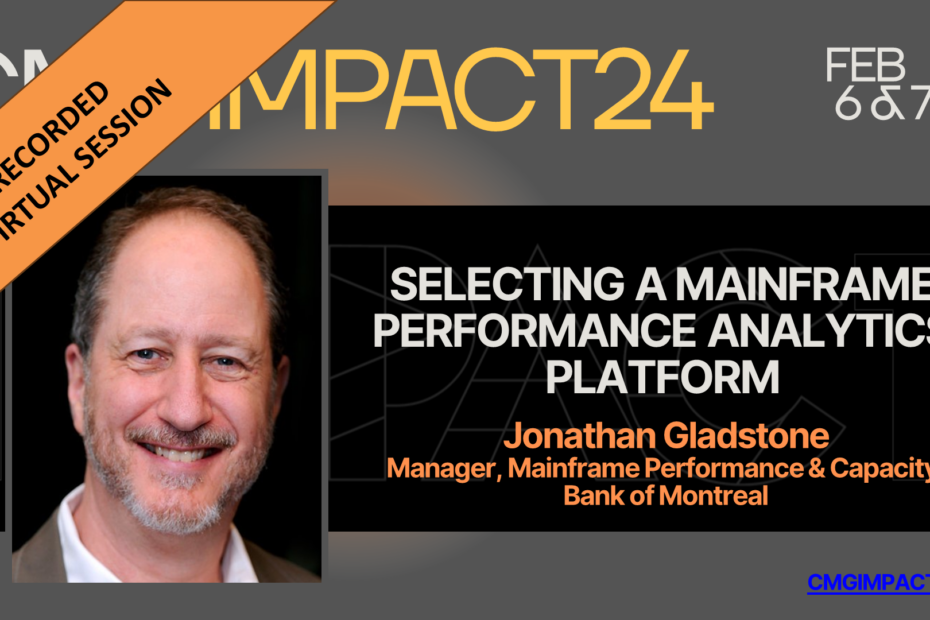
Selecting a mainframe performance analytics platform

Almost ten years ago I started exploring the possibility of moving away from homegrown mainframe performance analytics at the Bank of Montreal. Over a few years I built a long list of possible products and vendors, put together a cross disciplinary team who shared my interest, and eventually selected a vendor and tool to work with. This is (mostly) the story of how we went from long list, to short list, to selecting a single vendor.

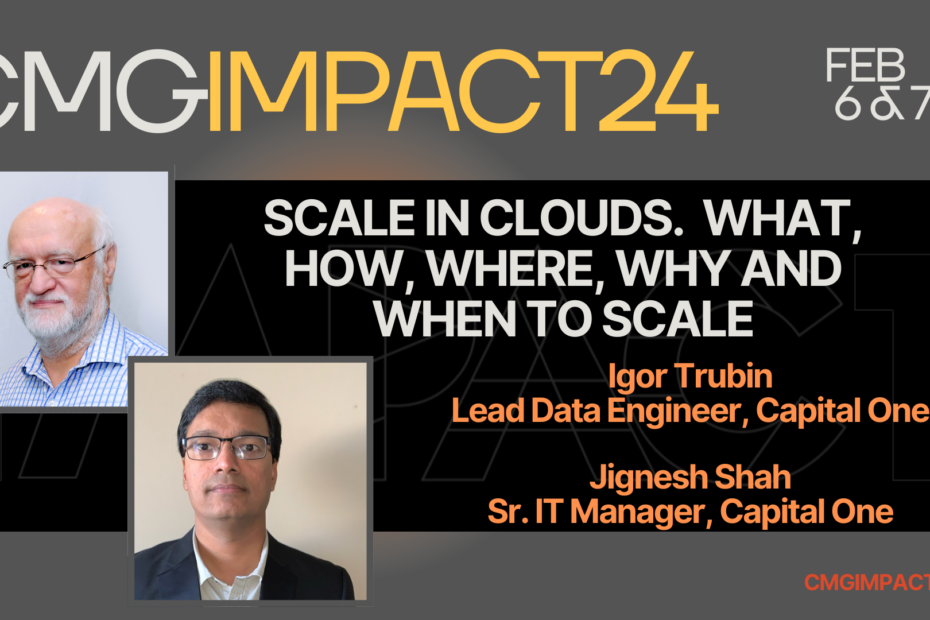
Scale in Clouds. What, How, Where, Why and When to Scale​

Presentation includes the following discussion themes.
– What to scale: servers, databases, containers, load balancers.
– How to scale: horizontally/rightsizing, vertically, manually, automatically, ML based, predictive, serverless.
– Where to scale: AWS (ASG,ECS, EKS, ELB), AZURE, GCP, K8s.
– Why to scale: cost optimization, incidents avoidance, seasonality.
– When to scale: auto-scaling policies and parameters, pre-warming to fight latency, correlating with business/app drivers.

Presentation includes a user case study of scaling parameters optimization: monitoring, modeling and balancing vertical and horizontal scaling, calculating optimal initial/desired cluster size and more.

redis

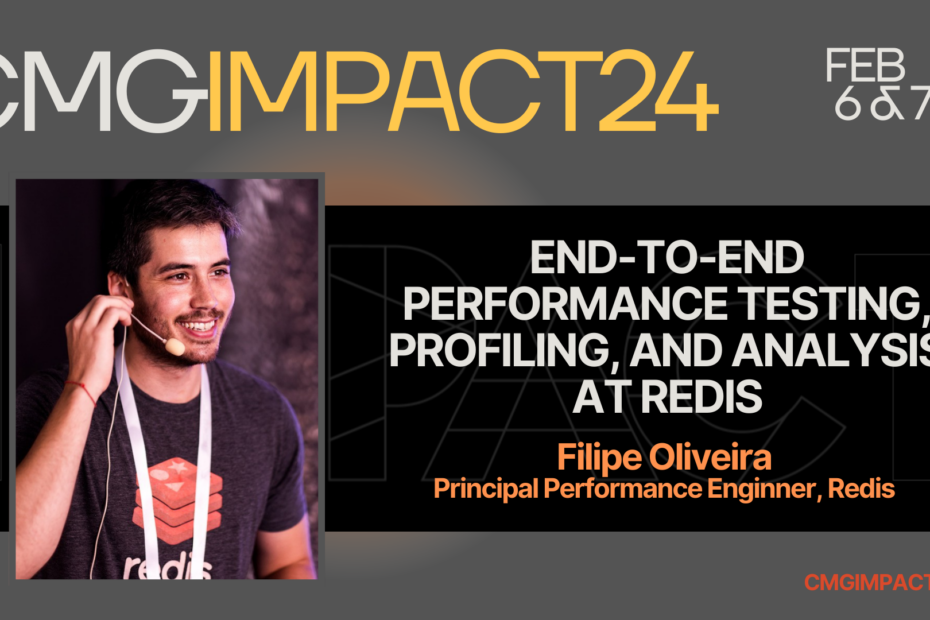
End-To-End Performance Testing, Profiling, and Analysis at Redis

This session is about best practices and lessons learned after building a cloud-agnostic multi-tenant SaaS application. It will cover topics related to tenant provisioning, passing context in microservices, tenant onboarding with AuthN and AuthZ, data partitioning, DevOps strategies, and cross-cutting concerns.

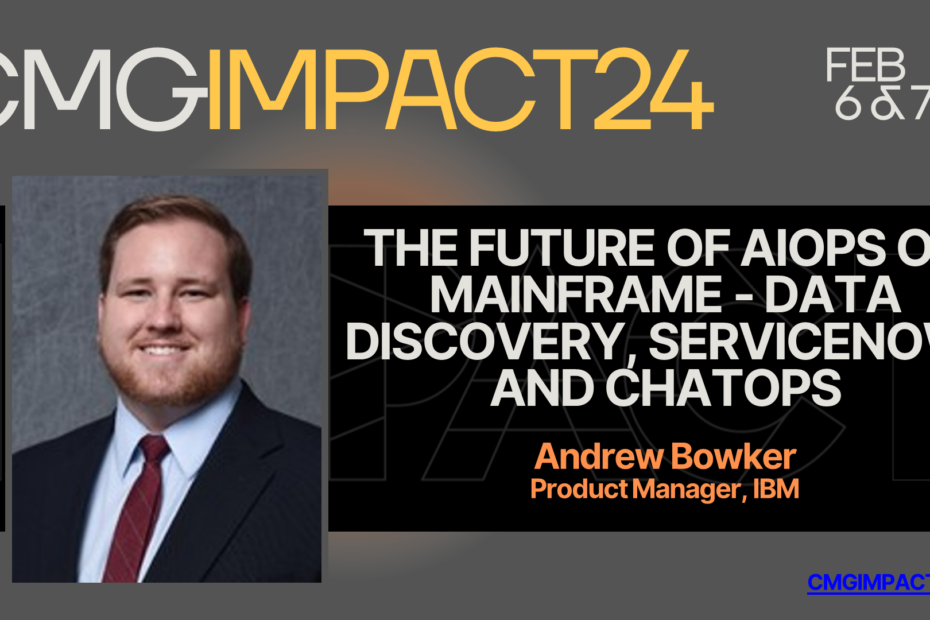
The future of AIOps on mainframe – data discovery, ServiceNow, and ChatOps

While ServiceNow has a comprehensive and robust ecosystem for distributed data/components, there are still many challenges for organizations trying to marry IBM Z and ServiceNow. Enterprises infrastructure teams need the ability to discover and map IBM Z resources into ServiceNow to unlock better incident remediation, better visibility across teams, and reduced mean time to repair. In this session you will learn how IBM Z Discovery for ServiceNow CMDB works and why “ChatOps” is becoming so pervasive for AIOps. We’ll discuss how ChatOps can be used for incident management in reducing the mean time to resolution, and why it can be a useful practice for Z shops wanting to leverage ServiceNow as a central source of truth tied to events stemming from mainframe.

Stormy Monday – Reactive and Preventive Capacity Management Processes

Monday has been a typical day where application outages occurred. Often, due to the complexity of the enterprise, Tuesday and the rest of the week were just the same! We will discuss how effective capacity management reporting is used to quickly return the business to service.

“What reporting should be reviewed and communicated in the first moments of an outage?

-What additional performance reporting is critical to resolving an incident?

-What reporting and capacity management processes contribute to improvements to the resiliency of the enterprise?

-What are some of the forecast variances that occur in predicting future capacity? Who is responsible for resolution?

-How should capacity management reporting be effectively used in the post-mortem process?”

decodfing

Decoding Ethics: Navigating the Ethical Dilemmas of Artificial Intelligence

This presentation delves into the ethical complexities arising from artificial intelligence’s (AI) integration into modern life. It highlights the gap between AI’s rapid technological advancements and the development of corresponding ethical guidelines. The talk categorizes ethical issues into five domains, using real-world examples like the Cambridge Analytica scandal and AI in healthcare, to illustrate the tangible impacts and moral challenges these issues present. It then explores solutions, such as ethical guidelines and regulatory oversight, emphasizing the collective responsibility of policymakers, technologists, and users in fostering ethical AI. The session culminates in an interactive Q&A, encouraging audience engagement in ethical discourse and practical problem-solving. Attendees will gain a thorough understanding of AI’s major ethical dilemmas, awareness of existing ethical frameworks, and insights into collaborative approaches to navigate the AI-augmented world responsibly.

Debugging Yourself: How to Move Forward When the Blocker is You

In the world of tech, we often find ourselves tangled in a web of bugs, blockers, and 404 errors—but what if the biggest blocker is sitting right in your chair? Yep, we’re talking about you. This talk, ‘Debugging Yourself: How to Move Forward When the Blocker is You,’ will dig deep into the human OS. We’ll pinpoint those pesky internal ‘bugs’ that are stopping you from leveling up in your tech career.

Just like debugging code, the first step to personal breakthrough is recognizing that something isn’t working. We’ll explore how to identify and interpret your own ‘error messages,’ from imposter syndrome to fear of failure. Then, we’ll introduce ‘patches’ for these issues—mental tools and reframing techniques that make change not just possible, but inevitable.

So, if you’re tired of roadblocks in your career path that seem suspiciously self-made, it’s time to roll up your sleeves and do a little self-debugging. Because you wouldn’t let a glitch ruin your code; don’t let one ruin your career.

The pitfalls and tradeoffs in allocating mainframe costs to the business

Most companies struggle to create business value from the huge amounts of capacity and performance data available to them. Questions like ‘who is using how much, when, at what cost and why?’ often result in ambiguous answers because of the complexity involved in mapping technical measurements such as SMF to applications and organizations. Part of the complexity is finding a balance between three opposing approaches: what is technically correct, what is fair or at least politically acceptable, and what is simple to implement and explain. Good data, tools and processes are also critical for success. This presentation is based on SMT Data’s many years of experience helping customers implement mainframe-based cost allocation. It discusses the common approaches and illustrates the pitfalls and tradeoffs that customers face.